But, after a 250 per cent accent, how do markets look today ? Where do the key valuation parameters (p/e, p/b and div. yield) stand today and what to they indicate ? The following charts tell the story -


Source: www.nseindia.com/content/indices/ind_statistics.htm
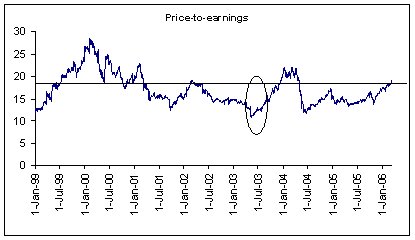
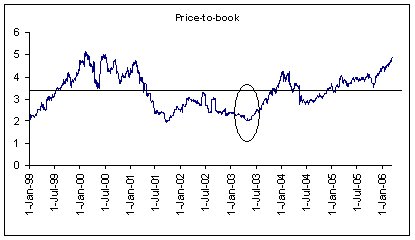
Of the three indicators, two (p/b and yield) clearly indicate stretched valuations. However, at 19 times p/e ratio remains modest, by historical standards. But, a further rise in stock prices will have to be supported by an earnings growth of 20% +. Will corporate India record such a growth ? If yes, then one needs to look for sectors that will lead this growth. Does anyone have a view on this ?
PS: The lines drawn in the last three charts represent six year average for the valuation ratios. For the p/e ratio it is 17 times, average for p/b and dividend yield is 3.3 times and 1.7%, respectively.


No comments:
Post a Comment